Copyright (C) 2023 Marlon Grodd, Martin Wolkewitz, Susanne Weber

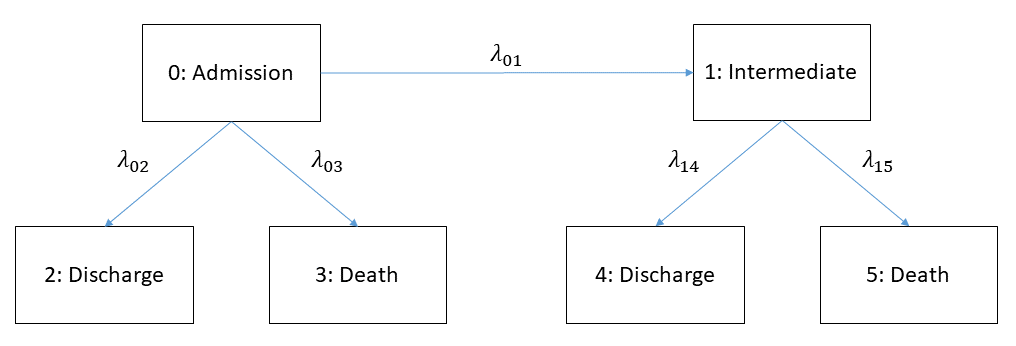
Extended illness-death model with constant transition hazards
This is a tool to visualize time-dependend effects in a multi-state-setting considering an extended illness-death model with constant hazards. Further details can be found here
- Two groups can be compared (Group A and Group B)
- Hazards can be provided in two ways:
- Explicit for each group (Group A and B)
- Baseline Hazards (Group A) and hazard ratios
- Description of items:
- "limit of x-axis": set the time horizon
- "order for stacked plot": order of the ploted areas in the stacked probability plots
- "Show PAF plot": Render the plot the population attributable fraction
- "Show PAF plot": Render the plot the attributable mortality
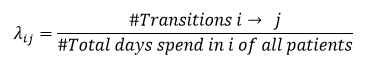
- Formula for Hazards:
Group A
Group B
Baseline
Hazard ratio
This work was supported by the Innovative Medicines Initiative Joint Undertaking resources (composed of financial contribution from the European Union’s Seventh Framework Programme (FP7/2007–2013) and EFPIA companies) [grant number 115737-2 – COMBACTE-MAGNET and 115523 – COMBACTE-NET]
https://www.ihi.europa.eu/